- Connect to OEM
- Connect to the Host
- From the Host –> Go to Target Tab

- From the listed target, select ASM by looking at type as “Automatic Storage Management”

- Now select type ASM, then we will be landed at ASM on OEM Grid Control.
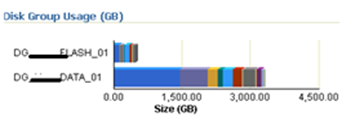
- On the Home Page of ASM, we can find the Disk group usage

- Also from the Home, go to tab Disk Group

Friday, September 30, 2011
How to monitor ASM Disk group usage on OEM Grid
Disk group has used % of safely usable free space
OEM Alert Message looks like;
| Message=Disk group DISGKGROUP_FLASH_01 has used 75.08% of safely usable free space. |
By default:
This metric will generate a warning alert if the Disk Group is using 90% of the Safely usable space and
Critical warning for 100 %. Threshold limit can be changed to generate alert at different values.
This metric is collected at a time interval of 15 minutes.
Metric Collection:
This metric is collected from the view V$ASM_DISKGROUP_STAT
| Used % of Safely Usable = 100 - (usable_file_mb/usable_total_mb)*100 Where usable_total_mb = total_mb - required_mirror_free_mb)/redundancy_factor |
total_mb and required_mirror_free_mb will come from the V$ASM_DISKGROUP_STAT view column and
| Redundancy Factor | Disk Group Type |
| 1 | External |
| 2 | Normal |
| 3 | High |
Query:
| select 100-(FREE_MB/TOTAL_MB)*100 as "Used % Safely Usable Area", Name from v$asm_diskgroup_stat |
Alternatively connect to ASM and check the free space;
| ASMCMD> lsdg |
Workaround:
If the Archive Log file occupies the ASM Disk group, move the files or delete files to free up Disk group.
Permanent Resolution:
Go to the Disk Group general page ---> and click on add button to add a new disk to a disk group.
Friday, September 23, 2011
find: missing conjunction
$ find . -type d –name siva*
Resolution: Use single quote on the string in –name clause
Ex: $ find . -type d –name ‘siva*’
How to find the open mode status of database?
Option 1:
| select status from v$instance; |
Option 2:
| select open_mode from v$database; |
Option 3:
Search Alert Log for string of “Database” or “alter database”.
How to generate AWR Report?
Method 1: By Querying
1. Query dba_hist_snapshot to find the snap id for the interval you are looking for.
| SELECT dbid, snap_id, begin_interval_time, end_interval_time from dba_hist_snapshot |
2.
| spool siv_awr_201109.lst |
Method 2:
| @?/rdbms/admin/awrrpt.sql |
It is an interactive script that can be used to generate HTML or text reports. The script prompts for type of report
requested and prompts for number of days of snapshots to choose from so based on that it displays snap ids to
choose the start and end snapshot it.
| @?/rdbms/admin/awrrpti.sql | Script can be used for the specified database and instance so the script in addition will prompt for dbid and instance number. |
| @?/rdbms/admin/awrddrpt.sql | Script can be used to generate a combine report of 2 different snapshots for comparison of performance in one report so it will prompt for two pairs of snapshot snapshots to compare against. |
| @?/rdbms/admin/awrinfo.sql | Script print AWR information like space usage by AWR, subset of AWR snap ids, Automatic Database Diagnostic Monitor (ADDM), Active Session History (ASH) information. |
Saturday, September 17, 2011
Sequence of steps performed when opening up a database
After issuing of SHUTDOWN ABORT command, when opening up database following step are performed
1. SPFile / PFile: Server Parameter file ( SP File ) or the initialization parameter (initSID.ora / PFILE ) file is read
2. Memory : SGA is allocated
3. Background Process: Background process are started
4. Control File : Control file is read
5. Redo Log File: Redo Log file is read
6. Data File: Data files are checked for consistency
7. Instance Recovery: Instance Recovery is started